Queue Server
Overview
The Queue Server application provides a graphical interface for the Bluesky Queue Server, allowing users to manage experiment queues, edit plans, control execution, and monitor status at beamlines and scientific facilities.
It communicates with the Queue Server’s HTTP API and optionally uses WebSocket connections for real-time status and console streaming.
The application provides two independent views, each available as a separate Phoebus application:
- Edit & Control Queue
Full queue management, plan editing, and execution controls.
- Queue Monitor
Read-only monitoring with collapsible panels and live console output.
Getting Started
To open the Edit & Control Queue:
Invoke the menu
Applications,Utility,Edit & Control Queue.
To open the Queue Monitor:
Invoke the menu
Applications,Utility,Queue Monitor.
Both applications connect to the same Queue Server instance and share connection state. Connecting in one application automatically connects the other.
Configuration
Set environment variables before launching Phoebus to configure the connection:
# Queue Server HTTP address (default: http://localhost:60610)
export QSERVER_HTTP_SERVER_URI=http://localhost:60610

# API key for authentication
export QSERVER_HTTP_SERVER_API_KEY=your_api_key

# Or point to a file containing the API key
export QSERVER_HTTP_SERVER_API_KEYFILE=~/.phoebus/qserver_api_key.txt
Alternatively, configure via Edit > Preferences > Queue Server.
Starting a Local Queue Server
Use the provided Docker setup for local development:
cd services/bluesky-services
docker-compose --profile container-redis up -d
This starts:
Bluesky Queue Server (RE Manager) on ports 60615/60625
HTTP Server REST API on port 60610
Redis database on port 6380
For details, see services/bluesky-services/README.md.
Edit & Control Queue
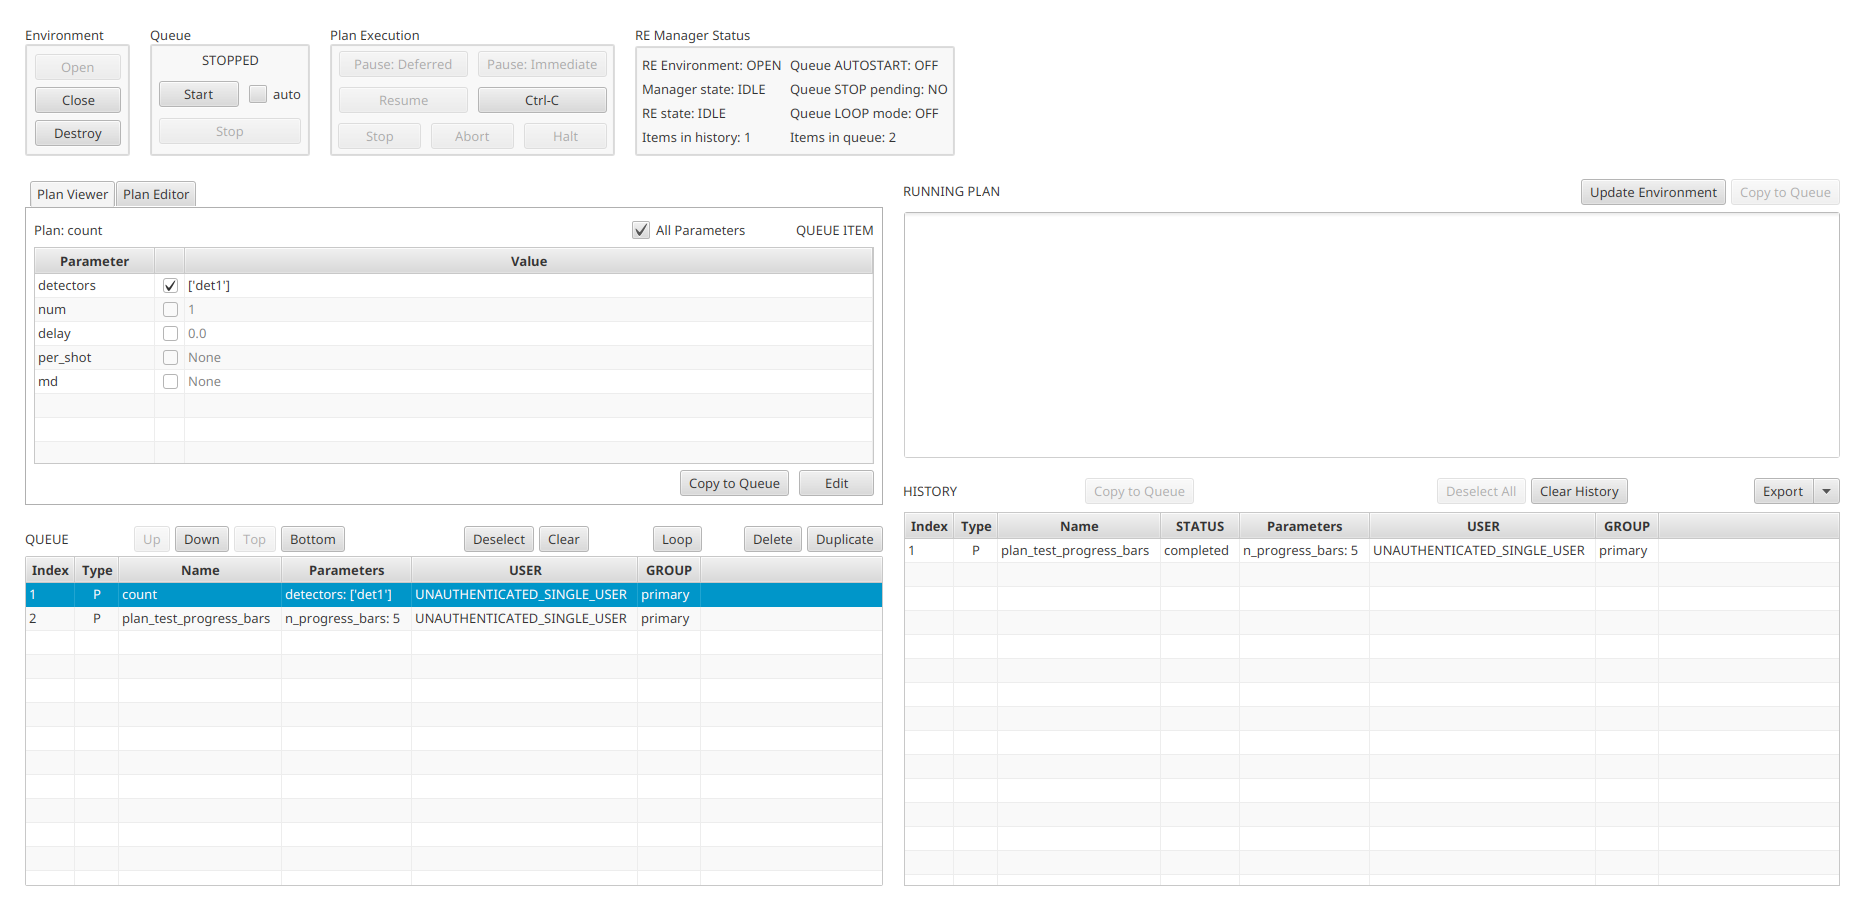
The Edit & Control Queue provides the full interface for managing the plan queue and controlling experiment execution.
The top of the window contains four control panels arranged left to right:
Environment – Open, Close, and Destroy the RE environment
Queue – Start/Stop queue execution with autostart checkbox
Plan Execution – Pause, Resume, Ctrl-C, Stop, Abort, and Halt controls
RE Manager Status – Live status grid showing environment state, manager state, RE state, queue/history counts, autostart, stop pending, and loop mode
Below the control panels, the window is split into two columns:
Left Column
Plan Manager (top-left) – A tabbed panel with two tabs:
Plan Viewer tab: Displays the parameters of the selected queue item in a table with Parameter, checkbox, and Value columns. An “All Parameters” checkbox toggles between showing only modified parameters and all parameters including defaults. Buttons at the bottom:
Copy to QueueandEdit.Plan Editor tab: Select between Plan and Instruction using radio buttons, then choose a specific plan from the dropdown. Edit parameter values in the table. Buttons at the bottom:
Batch Upload,Add to Queue,Save,Reset, andCancel.
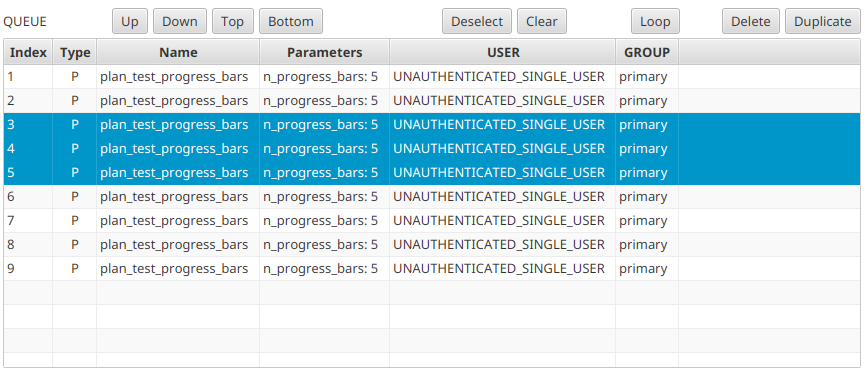
Plan Queue (bottom-left) – Table showing queued items with columns:
Index, Type, Name, Parameters, USER, GROUP.
Toolbar buttons: Up, Down, Top, Bottom, Deselect,
Clear, Loop (toggle), Delete, Duplicate.
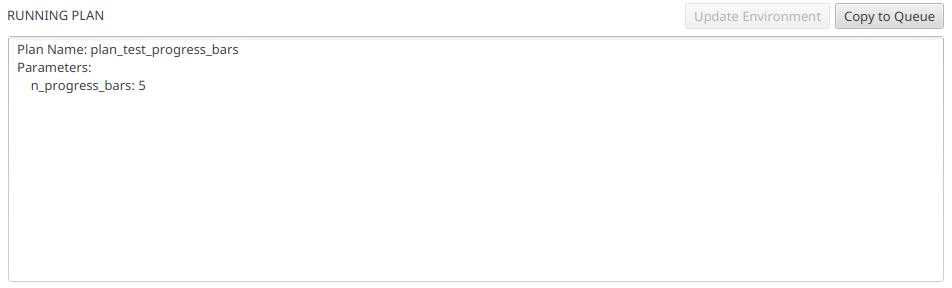
Right Column
Running Plan (top-right) – Shows the currently executing plan
as formatted text. Buttons: Update Environment and Copy to Queue.
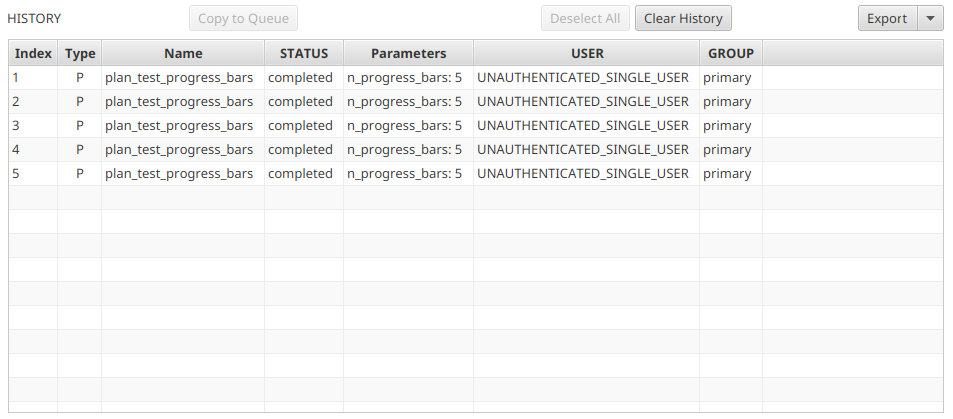
Plan History (bottom-right) – Table of completed plans with columns:
Index, Type, Name, STATUS, Parameters, USER, GROUP.
Toolbar buttons: Copy to Queue, Deselect All, Clear History,
and Export (split button with TXT, JSON, and YAML options).
Queue Monitor
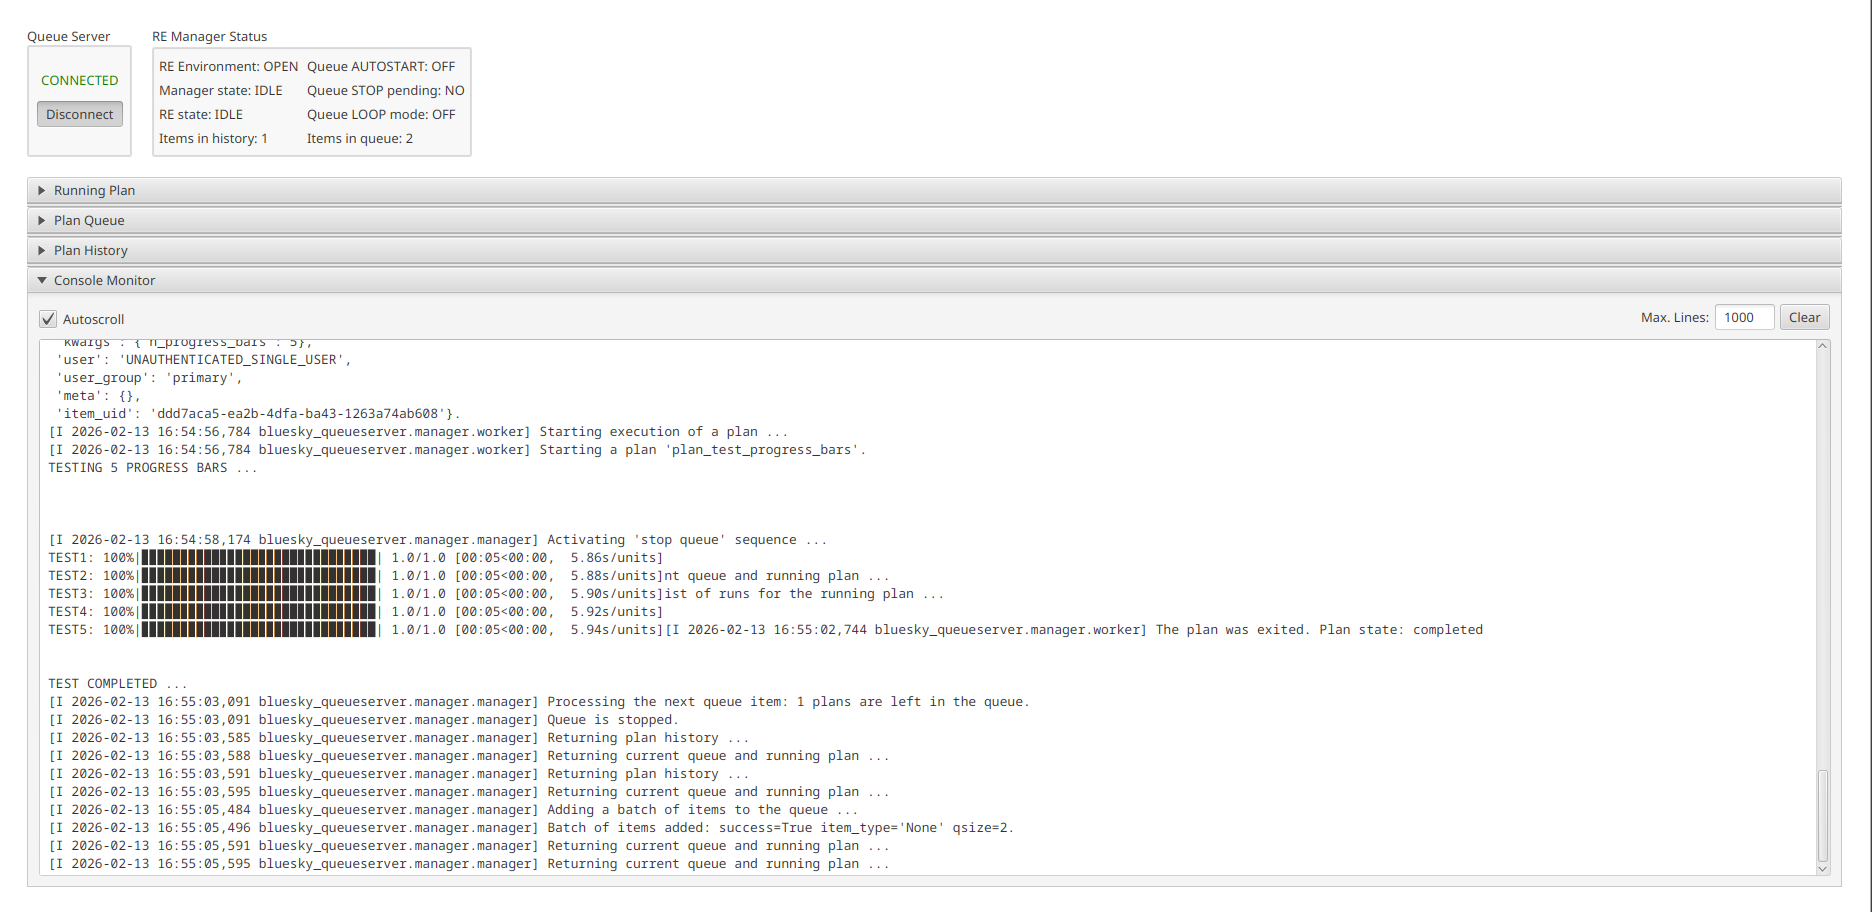
The Queue Monitor provides a compact, read-only view of the queue state, suitable for wall displays or passive monitoring.
The top of the window shows:
Queue Server connection widget (left) with status label and Connect/Disconnect toggle
RE Manager Status grid (right) with the same status fields as the Edit & Control view
Below the top bar, four collapsible TitledPane sections
are stacked vertically:
Running Plan (collapsed by default) – Same running plan display
Plan Queue (collapsed by default) – Read-only queue table
Plan History (collapsed by default) – Read-only history table
Console Monitor (expanded by default) – Live console output
Expand or collapse each section by clicking its header.
Connection Widget
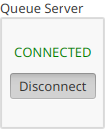
The connection widget shows the current connection status and provides a toggle button to connect or disconnect.
The connection status label changes color to indicate the current state:
By default, the widget auto-connects on startup. If the connection is lost, it automatically attempts to reconnect every 5 seconds.
When both Edit & Control Queue and Queue Monitor are open, they share the same connection. Toggling the connection in either application affects both.
Environment Controls
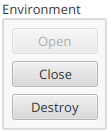
The Environment panel manages the RunEngine environment:
Open: Initialize the RE environment (required before running plans)
Close: Gracefully shut down the RE environment
Destroy: Force-terminate the environment (use if Close hangs)
Buttons are enabled or disabled based on the current environment state.
Queue Controls
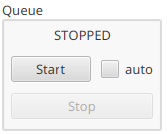
The Queue panel controls queue execution:
Start: Begin executing queued plans
Stop: Stop after the current plan completes
auto: Checkbox to enable autostart when the environment opens
The status label shows the current queue execution state (e.g., STOPPED, RUNNING).
Execution Controls
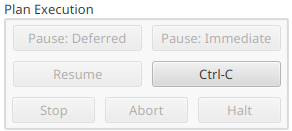
The Plan Execution panel provides fine-grained control over the currently running plan:
Pause: Deferred – Pause at the next checkpoint
Pause: Immediate – Pause immediately
Resume – Resume a paused plan
Ctrl-C – Send interrupt signal
Stop – Stop the plan gracefully
Abort – Abort the plan immediately
Halt – Emergency halt (no cleanup)
RE Manager Status
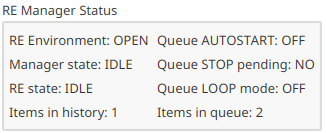
The status panel displays a grid of live information:
Left Column |
Right Column |
|---|---|
RE Environment |
Queue AUTOSTART |
Manager state |
Queue STOP pending |
RE state |
Queue LOOP mode |
Items in history |
Items in queue |
Values update in real-time as status messages arrive from the server.
Console Monitor
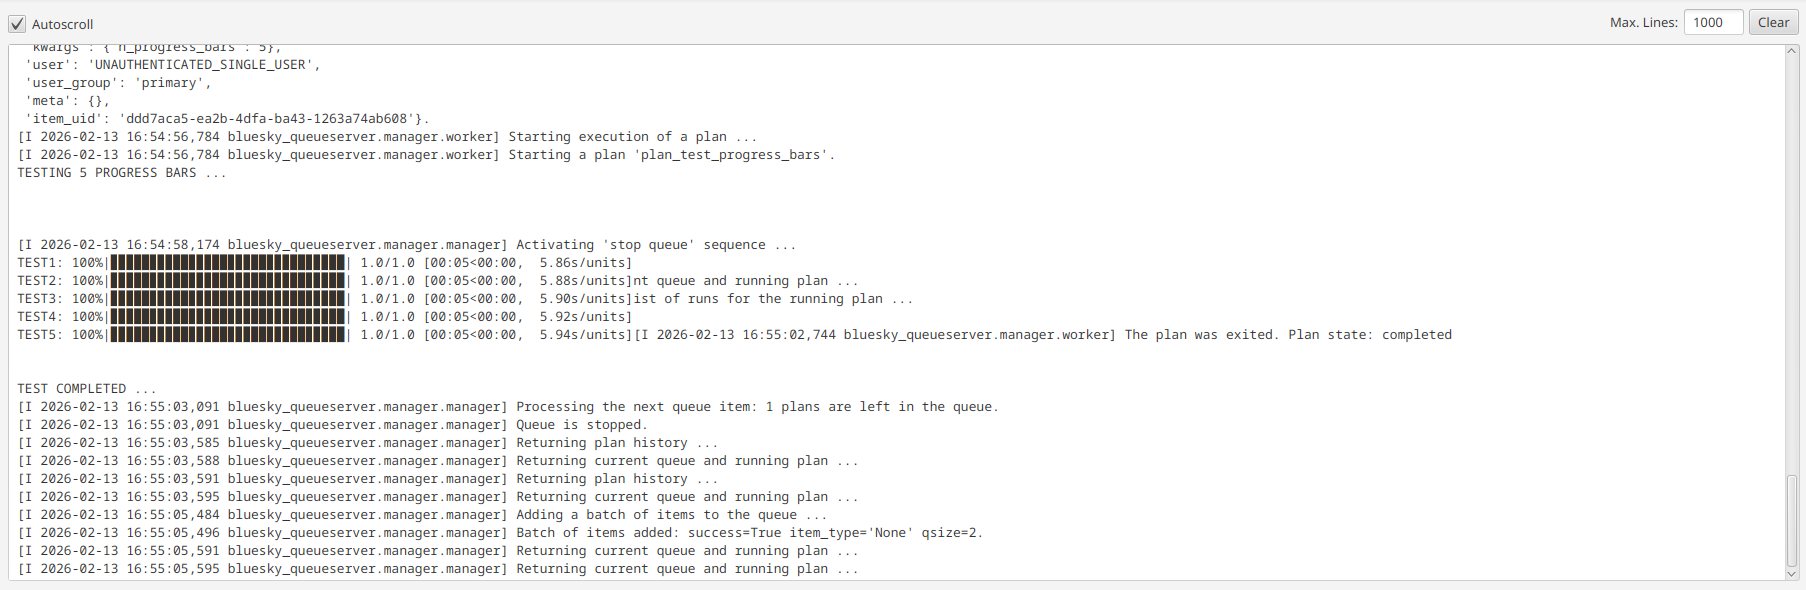
The Console Monitor streams live output from the Queue Server via WebSocket (or HTTP polling as fallback).
Controls:
Autoscroll: Checkbox to auto-scroll to the latest output (enabled by default)
Max. Lines: Text field to limit the number of displayed lines
Clear: Clear the console output
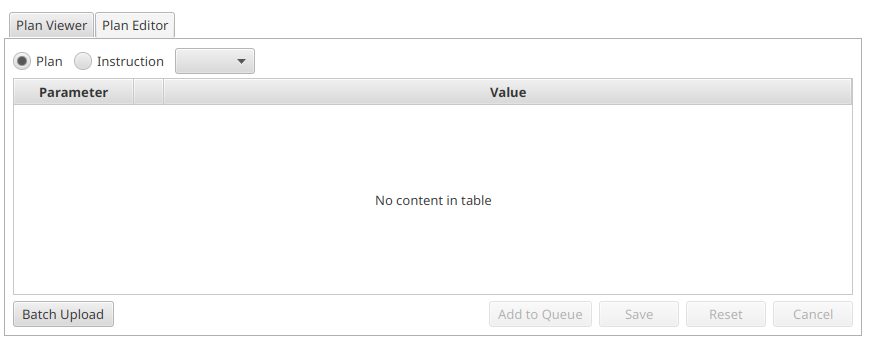
Plan Editor
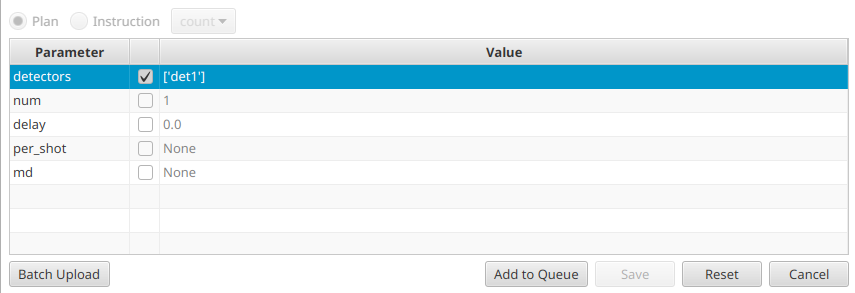
The Plan Editor tab allows creating new plans or editing existing ones.
Select Plan or Instruction using the radio buttons.
Choose a plan from the dropdown (populated from the Queue Server’s list of allowed plans).
Edit parameters in the table. Each row shows the parameter name, a checkbox to include it, and an editable value field.
Parameter values support Python types: strings, integers, floats,
lists, dictionaries, booleans, and None.
Buttons:
Batch Upload: Upload plans from a file
Add to Queue: Add the configured plan to the queue
Save: Save edits to an existing queue item
Reset: Restore default parameter values
Cancel: Discard changes
Plan Viewer
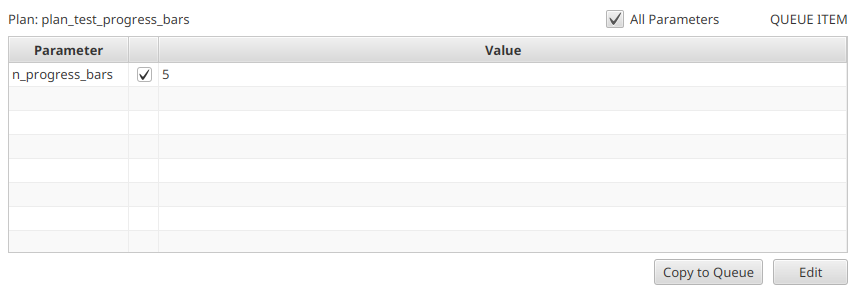
The Plan Viewer tab displays the parameters of the selected queue or history item in a read-only table.
All Parameters: Toggle to show all parameters including defaults
Copy to Queue: Duplicate the item back into the queue
Edit: Switch to the Plan Editor tab with this item loaded
Preferences
Configure via Edit > Preferences > Queue Server.
Environment variables override preference file values.
Troubleshooting
Connection stays at NETWORK
Verify the Queue Server HTTP API is running and reachable
Check the
queue_server_urlpreference orQSERVER_HTTP_SERVER_URIVerify the API key is correct
Connection shows STATUS (red)
The WebSocket connected but the RE Manager is not sending status updates
Check that the RE Manager process is running on the server side
Plans dropdown is empty
The environment must be open for the list of allowed plans to load
Check the console output for error messages
Console output not streaming
WebSocket streaming is preferred; verify
use_websockets=trueIf WebSocket fails, the application falls back to HTTP polling at the interval set by
update_interval_ms