Alarm Logging Service
The alarm logging service records all alarm messages to create an archive of all alarm state changes and the associated actions.
This historical data can be used to:
Discover alarm patterns and trends
Generate Statistical reports on alarms
Debug the alarm system
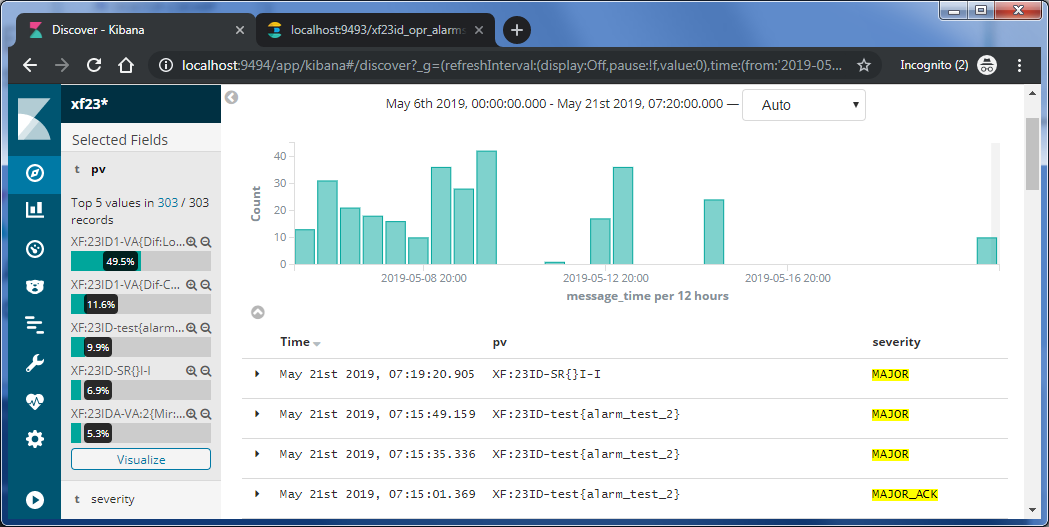
Logged Alarm Messages
The alarm logging service creates kafka streams which can be configured to monitor one or more alarm topics. All associated with state change or configuration change are filtered, time stamped and added to an elastic index.
Examples:
Configuration changes
e.g. when new alarm nodes or pvs are added or removed or existing ones are enabled/disabled
State changes
e.g. alarm state changes from OK to MAJOR
Commands
e.g. a user actions to Acknowledge an alarm
Automatic purge of Elasticsearch indices
To avoid issues related to a high number of Elasticsearch indices, automatic purge can be enabled in order to delete
indices considered obsolete. This is done by setting the preferences date_span_units and retain_indices_count such
that they evaluate to a number larger or equal to 100. The default retain_indices_count is 0, i.e. automatic purge is disabled by default.
The automatic purge is run using a cron expression defined in preference purge_cron_expr, default is
0 0 0 * * SUN, i.e. midnight each Sunday. See the SpringDocumentation on how to define the cron expression.
An Elasticsearch index is considered eligible for deletion if the last inserted message date is before current time
minus the number of days computed from date_span_units and retain_indices_count.
API
- GET /search/alarm
Search alarms
- Query Parameters:
pv (string) – PV name
severity (string) – Alarm severity
message (string) – Alarm message
current_severity (string) – PV severity
current_message (string) – PV message
user (string) – User
host (string) – Host
command (string) – Command
start (string) – Start time
end (string) – End time
- Status Codes:
200 OK – successful operation
- GET /search/alarm/config
Search alarm config
- Query Parameters:
config (string) – Config path
- Status Codes:
200 OK – successful operation